Performance
LLM-generated draft — not proofread
This page was drafted by an LLM and has not been reviewed by a human. Treat every claim as unverified until a maintainer signs off.
This page describes the architectural performance characteristics of MeshStor — derived from the data path, not measured in production. For the maturity context and benchmark status, see Project Status. To run your own numbers in about an hour, skip to "How to get real numbers in an hour" below.
The data path in one diagram
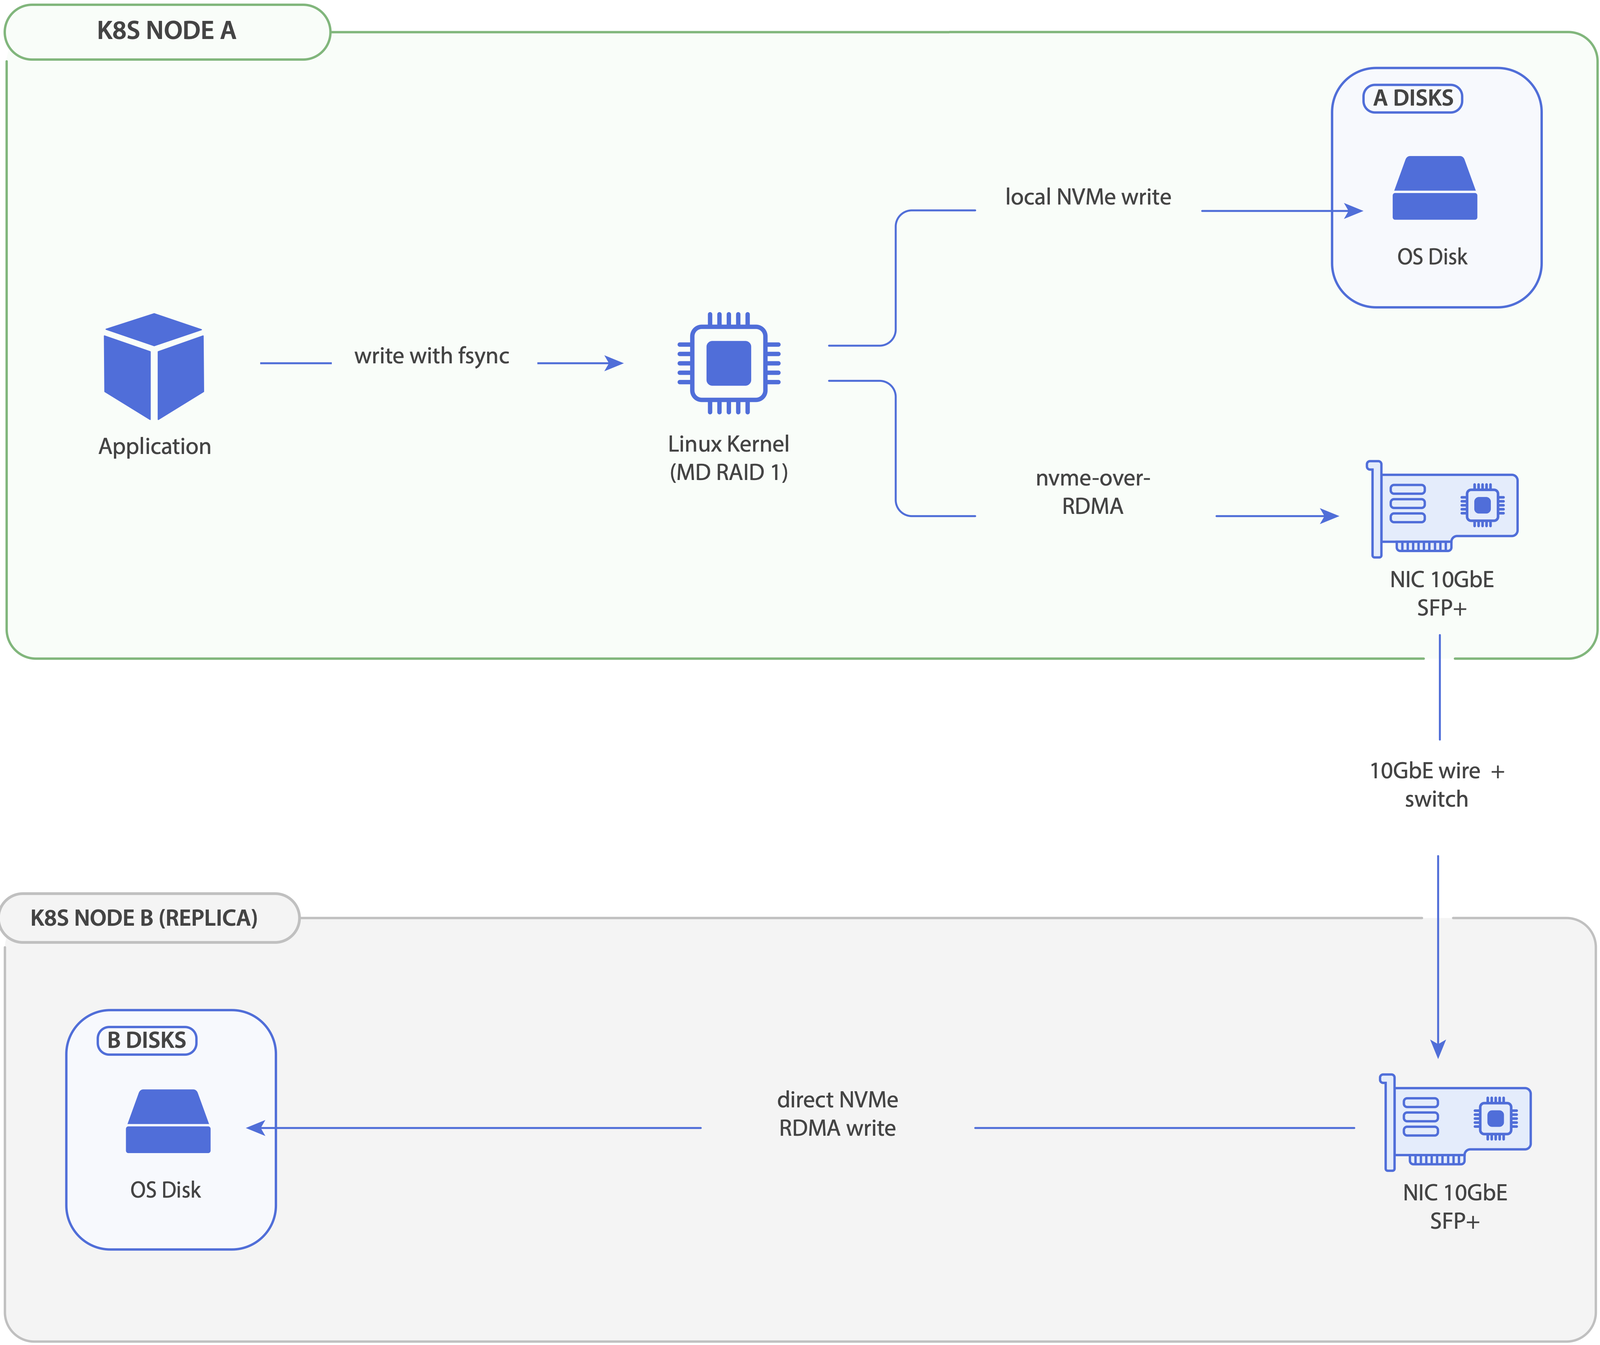
The above is for a write to a replicaCount=2 volume. Pod-observed write latency is max(local_latency, remote_latency) — both replicas are written in parallel, and the local member goes through the block layer directly (no NVMe-oF loopback). For replicaCount=1, the diagram collapses to the local-only branches.
Reads take only one of the two paths per IO: MD selects the replica with the lowest latency_ewma × (pending + 1) cost (custom MeshStor kernel module behaviour), so steady-state reads bias toward the local replica and overflow to remote only when local queue depth makes the costs comparable. Sequential streams pin to one disk to avoid re-seeking. See Architecture → I/O characteristics for the full read/write breakdown.
Where MeshStor should be fast
- The data path is in the kernel from end to end. No userspace IO engine, no SPDK pollers, no proxy daemon. Each hop is either a kernel function call or a kernel network send.
- No copy-out and copy-in for replication. The MD layer issues bios directly to the local block device and to the NVMe-oF host driver. There is no userspace memcpy in the write path.
- RDMA is recommended — it's where MeshStor shines most. TCP is a capable, but when both nodes have RDMA-capable NICs and the cluster is annotated correctly, NVMe-oF uses RDMA on port 4421. RDMA latency is typically a small number of microseconds vs. tens of microseconds for TCP, with near-zero CPU overhead on the data path.
- No per-IO-engine core pinning. Unlike user-space SPDK-based stacks, MeshStor's data path can yield to other work on the node. There is no constant 100% CPU consumption from poller threads.
Where MeshStor will be slower than you hope
- First-write-after-create allocates blocks. XFS allocates extents on first write, which adds metadata IO. This is true of any XFS volume, but it's worth knowing about when interpreting your first benchmark run.
- The replication multiplier is real. A
replicaCount=3write puts pressure on three nodes' network and three backing devices. Throughput is bounded bymin(network_per_node, disk_per_node). - Cross-rack latency dominates RDMA's advantage. RDMA reduces the per-packet latency, but if your remote replica is in another rack with 100µs of switching latency, the per-packet improvement is in the noise.
How to get real numbers in an hour
The fastest way to know how MeshStor performs on your hardware is to run fio on a freshly created volume. The recipe below covers the three workload patterns that matter for most evaluations.
Step 1: Create a test volume
kubectl apply -f - <<EOF
apiVersion: v1
kind: PersistentVolumeClaim
metadata:
  name: meshstor-bench
spec:
  accessModes: [ReadWriteOnce]
  storageClassName: mesh-2copy-tcp
  resources:
    requests:
      storage: 50Gi
EOF
Step 2: Run fio in a debug pod
kubectl run fio-bench --rm -it --image=ljishen/fio --restart=Never \
  --overrides='{"spec":{"containers":[{"name":"fio-bench","image":"ljishen/fio","volumeMounts":[{"name":"v","mountPath":"/data"}],"command":["sleep","3600"]}],"volumes":[{"name":"v","persistentVolumeClaim":{"claimName":"meshstor-bench"}}]}}'

# in another terminal:
kubectl exec -it fio-bench -- fio \
  --name=randread --filename=/data/test.bin --size=10G \
  --bs=4k --rw=randread --ioengine=libaio --iodepth=32 \
  --runtime=60 --time_based --direct=1
Repeat with --rw=randwrite and --rw=write --bs=1M --iodepth=8 for the random-write and sequential-write patterns.
Step 3: What to look at
iopsandlat (avg)for random read — this is the latency-sensitive number that matters for OLTP databases.iopsfor random write — bounded by replication multiplier.bwfor sequential write — bounded bymin(network_per_node, disk_per_node) ÷ N.
What to ignore
- The first 5–10 seconds of any run. XFS allocation, MD initial sync, and TCP slow-start all skew early measurements.
--bs=512results unless you genuinely run 512-byte IO. Below the device's logical block size you measure the kernel's block-merging behavior, not MeshStor's data path.
What's Next
- Architecture — the layered data path this page analyzes
- Replication — RAID-level performance characteristics
- Comparison — head-to-head with other replicated and local CSIs
- Tuning — optional host-side knobs for fast fabrics